This is the Stable version of the documentation. The latest version is experimental and under active development. You can use the version selector in the top-right menu to switch versions for this specific page, or click here to go to the latest version's homepage.
Gather Onboarded Application Metrics
Prerequisites
Section titled “Prerequisites”Instructions
Section titled “Instructions”-
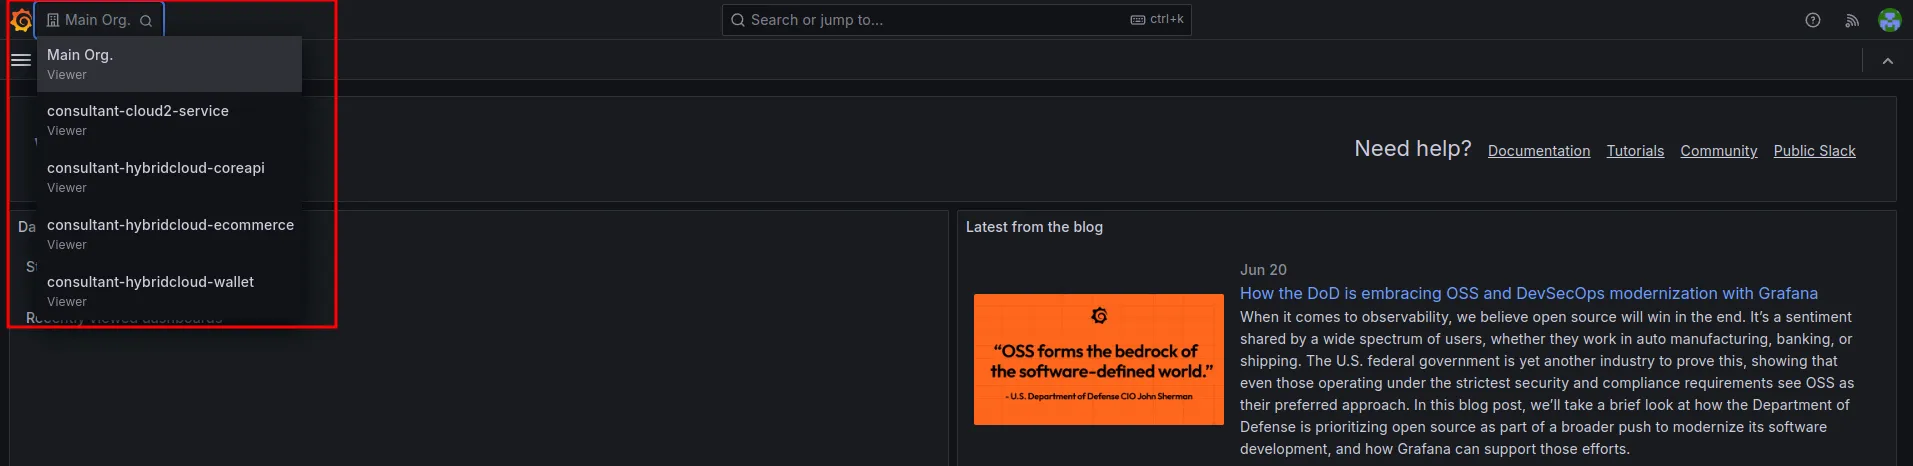
เลือก Organization ที่ต้องการที่เมนู Switch Organization โดยเลือก Organization ตามชื่อ Service ในระบบ Opstella
-
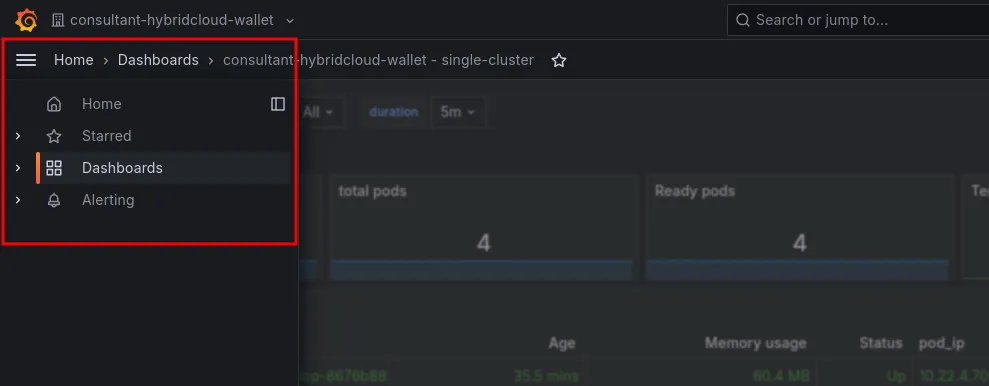
เลือกเมนู Dashboard ดังรูป
-
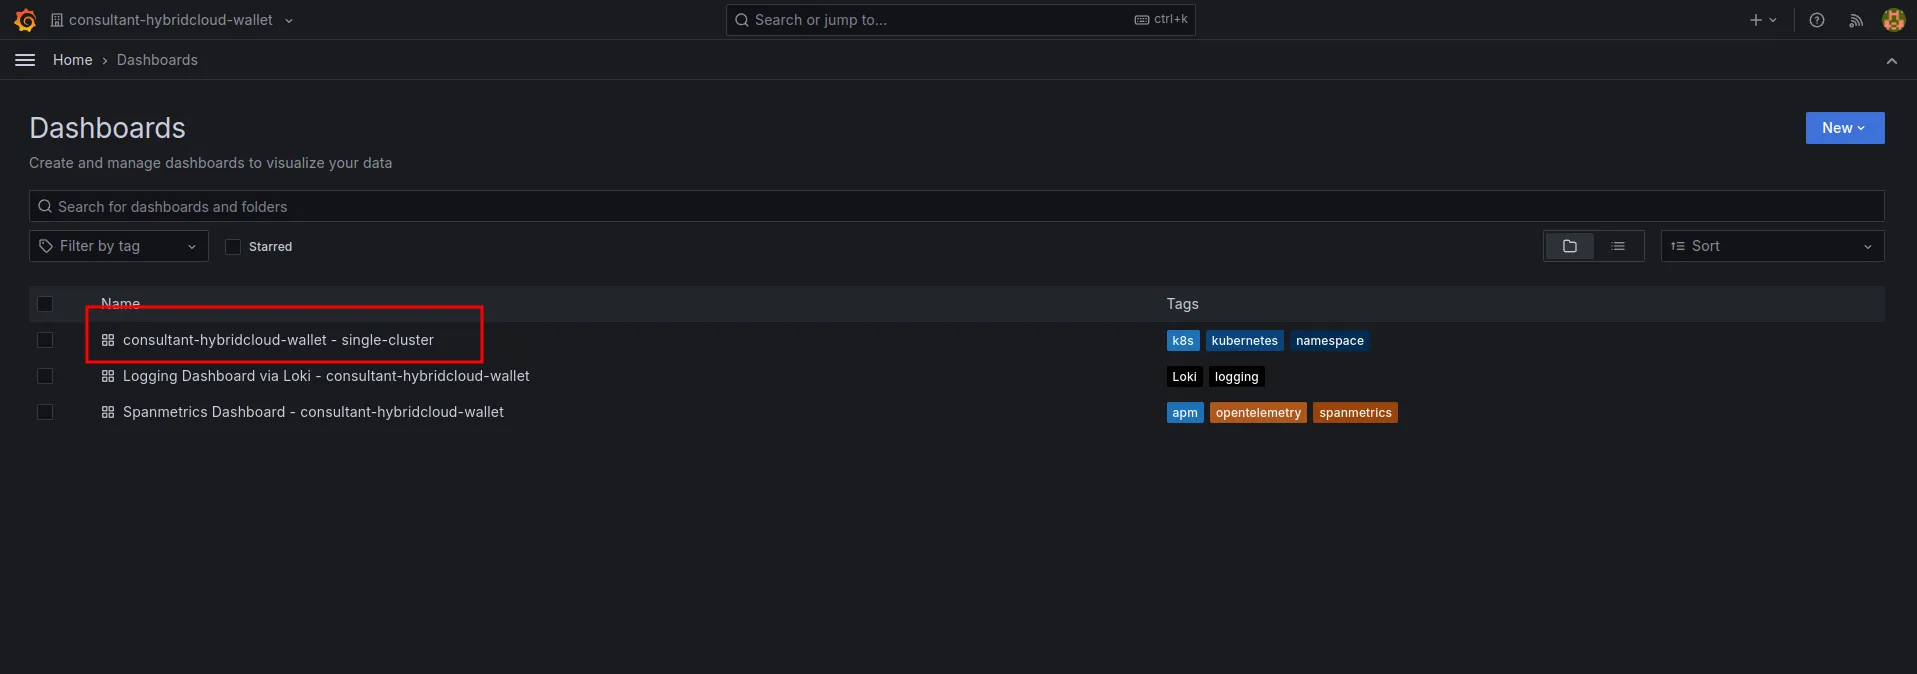
คลิกเลือก Dashboard ดังรูป เพื่อดู Metrics
-
ระบบจะแสดง Dashboard ของ Metrics ดังรูป
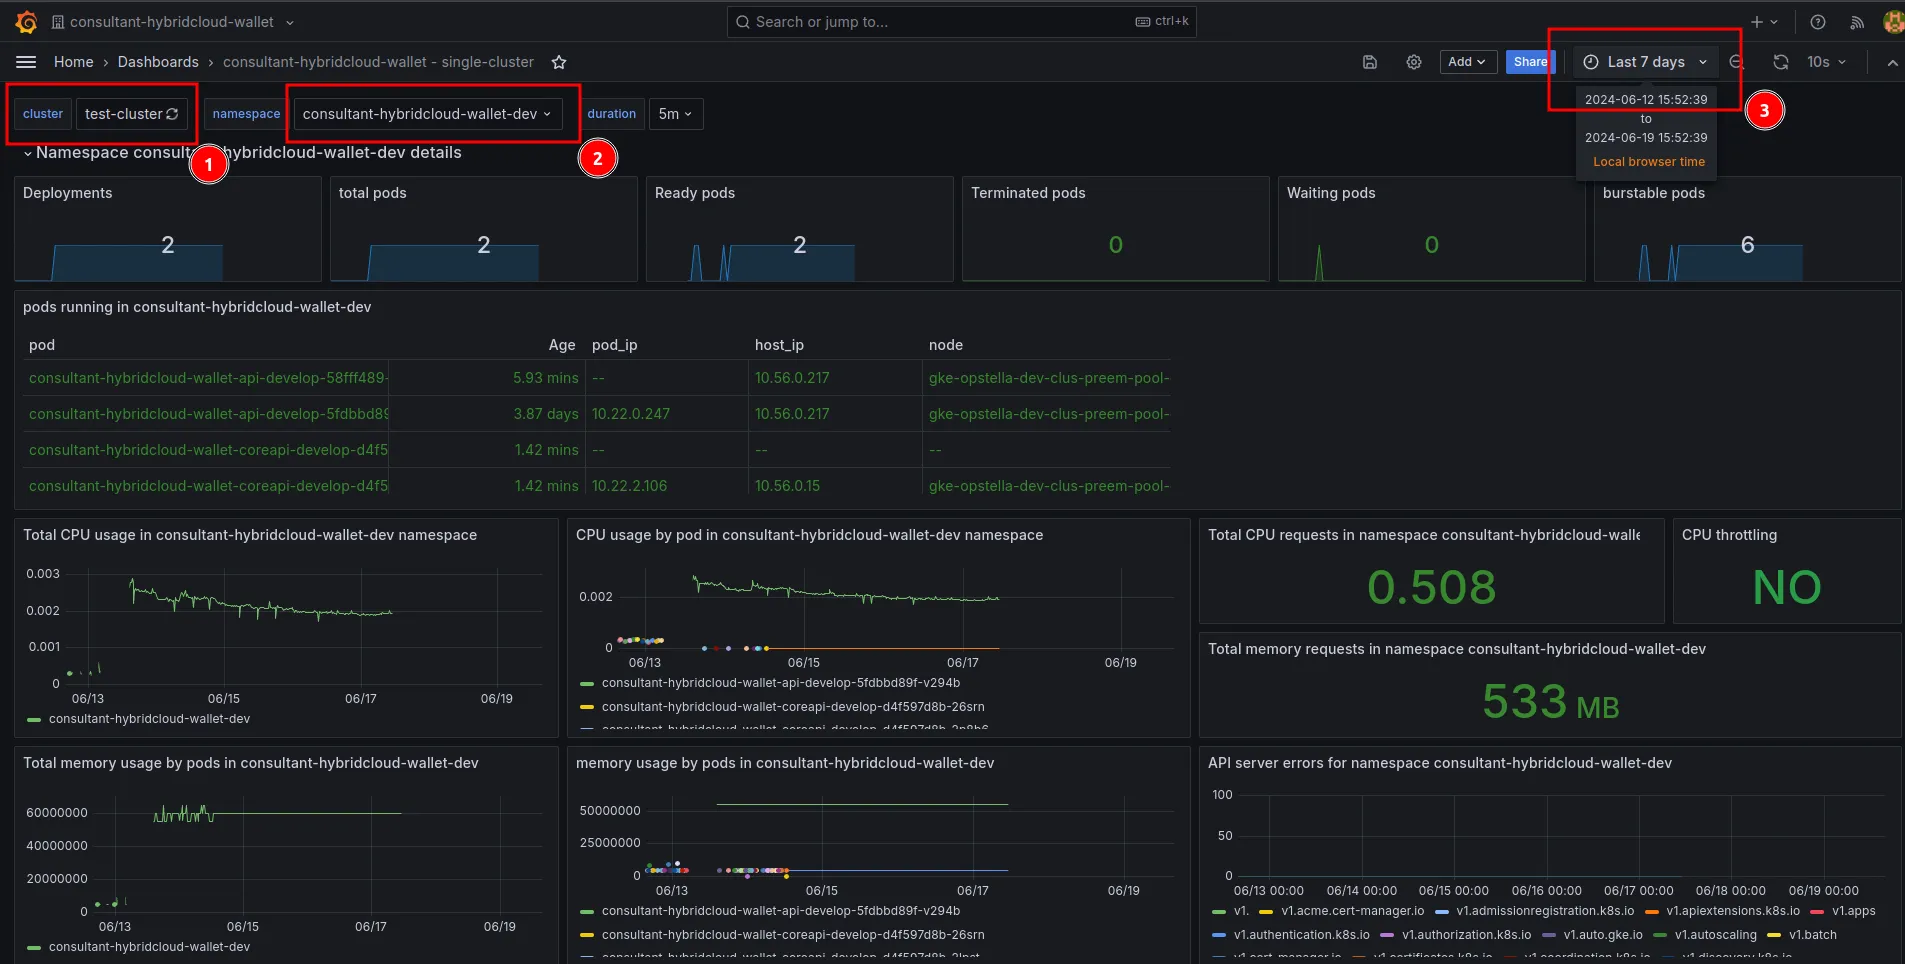
รายละเอียด Dashboard
- Cluster ที่ต้องการดูข้อมูล
- Namespace แยกตาม Environment
- ช่อง Filter เวลาของข้อมูล
Finished?
Use the below navigation to proceed