This is the Experimental version (Latest). It is under active development and may change. For the most reliable documentation, use the version selector in the top-right to switch to Stable, or click here to go to the Stable version's homepage.
Integrate with OpenTelemetry
Last updated:
What is OpenTelemetry?
Section titled “What is OpenTelemetry?”Opentelemetry คือ เครื่องมือสำหรับช่วยทำงานในการติดตามการทำงาน โดยแสดงเส้นทางของ request จนจบการทำงาน โดยสามารถบันทึกข้อมูล และติดตามได้ โดยใน Opstella OpenTelemetry จะทำการ Tracing Service ต่างๆ แล้วส่งข้อมูลเข้า Mimir แล้วข้อมูลจึงถูกไปแสดงบน Grafana ดังรูป
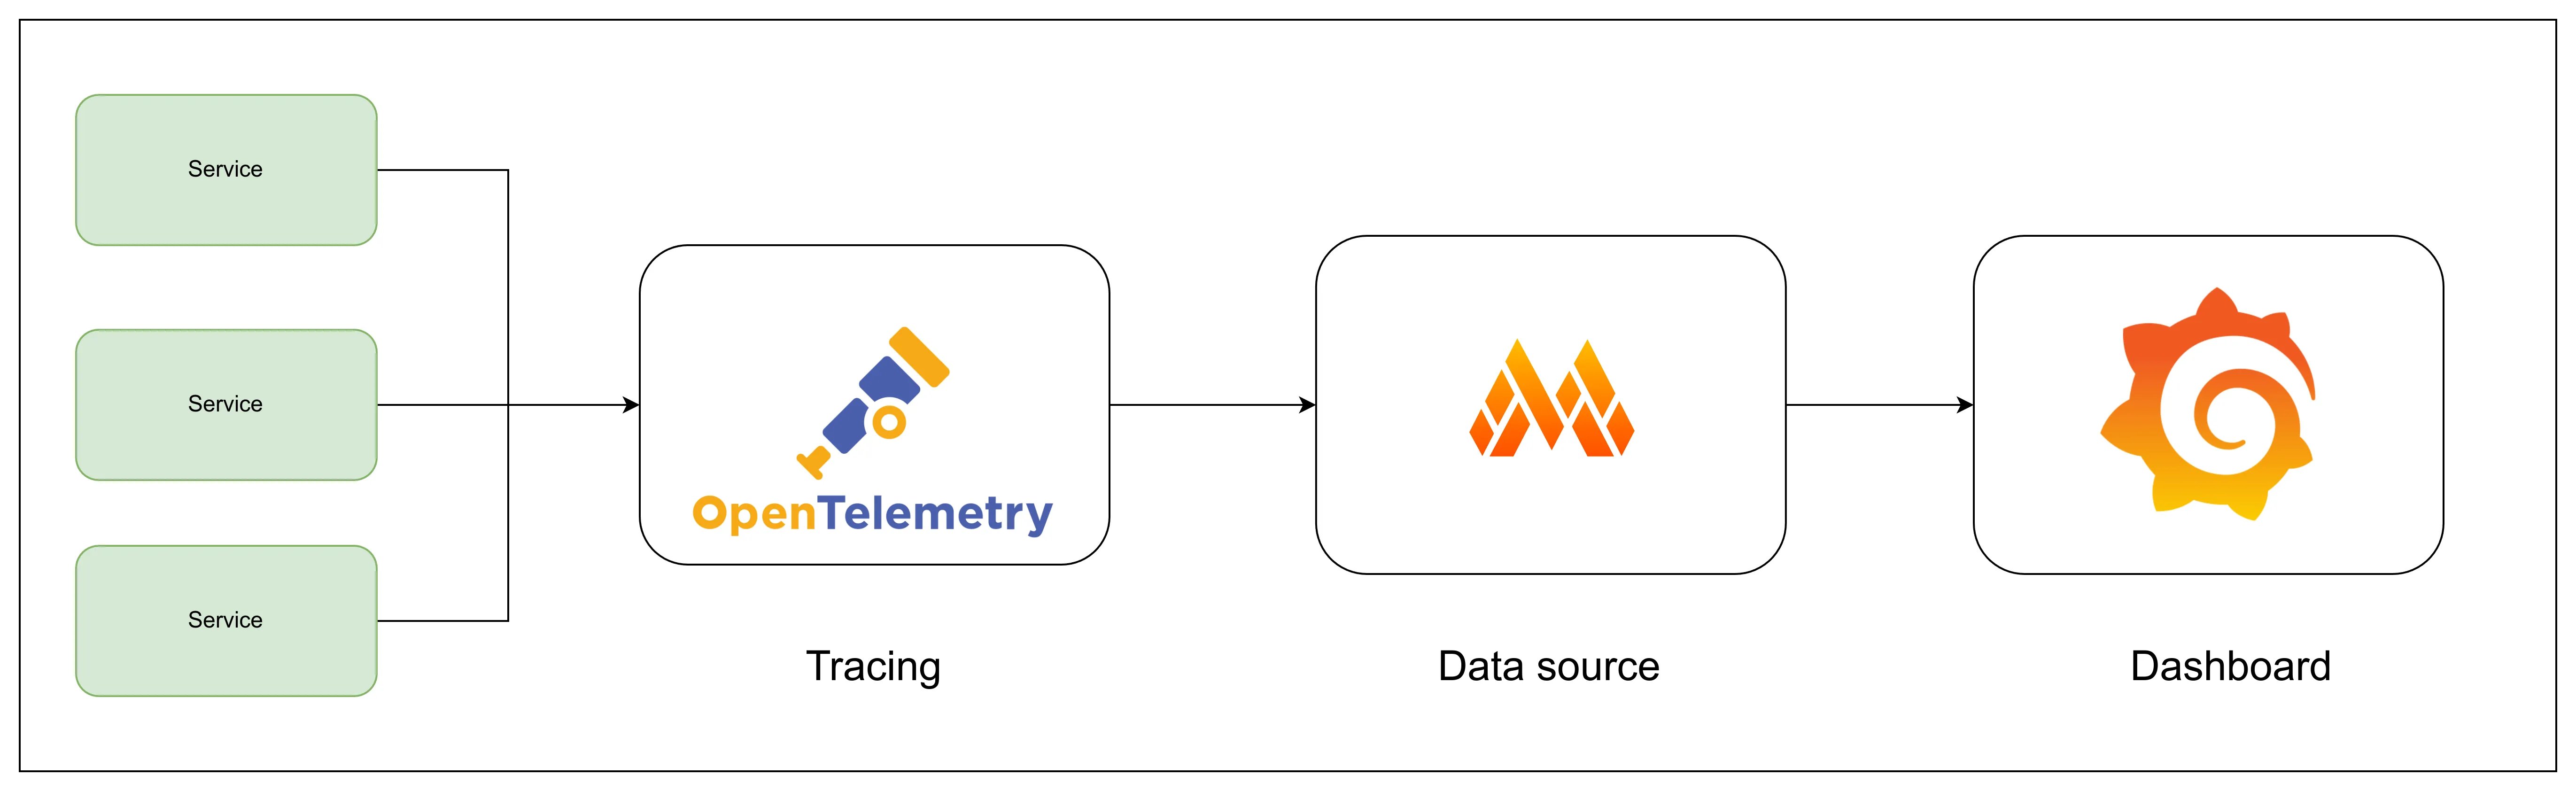
จากรูป OpenTelemetry จะดึง Tracing จาก pod และส่งไปยัง Mimir โดยใน pod จะต้องมีการเขียน Tracing แล้วส่งไปยัง OpenTelemetry โดยจะมี Library ในแต่ละภาษาช่วยทำงานนี้ ยกตัวอย่าง
OpenTelemetry Instrumentation
Section titled “OpenTelemetry Instrumentation”Python ที่ใช้ FastAPI Framework จะต้องมี Library ที่ต้องติดตั้ง ดังนี้
requirements.txt
opentelemetry-distro==0.46b0opentelemetry-exporter-otlp==1.25.0opentelemetry-instrumentation-fastapi==0.46b0fastapi==0.111.0uvicorn==0.15.0python-dotenv==0.19.0opentelemetry-instrumentation-logging==0.46b0นอกจากนี้ต้องเขียน Environmemt Variable ดังต่อไปนี้ (ใน Python จะดึงตามชื่อ แต่ละในภาษาอื่น หรือ Framework อื่นต้องดูตาม Document)
OTEL_EXPORTER_OTLP_ENDPOINT=**endpoint ของ opentelemetry **OTEL_EXPORTER_OTLP_PROTOCOL=grpcOTEL_LOGS_EXPORTER=otlpOTEL_METRICS_EXPORTER=noneOTEL_PYTHON_LOG_CORRELATION=trueOTEL_RESOURCE_ATTRIBUTES=**ชื่อของ service ที่จะทำการ tracing**ในส่วนการส่ง Tracing ไปยัง OpenTelemetry
import asyncioimport randomimport timeimport osfrom fastapi import FastAPIfrom opentelemetry import trace
# using sdkfrom opentelemetry._logs import set_logger_providerfrom opentelemetry.exporter.otlp.proto.grpc._log_exporter import (    OTLPLogExporter,)from opentelemetry.sdk._logs import LoggerProvider, LoggingHandlerfrom opentelemetry.sdk._logs.export import BatchLogRecordProcessor
# how to use instrumentationfrom opentelemetry.instrumentation.logging import LoggingInstrumentor
import loggingimport sys

tracer = trace.get_tracer(__name__)
app = FastAPI()logger_provider = LoggerProvider()
set_logger_provider(logger_provider)
exporter = OTLPLogExporter(insecure=True)logger_provider.add_log_record_processor(BatchLogRecordProcessor(exporter))handler = LoggingHandler(level=logging.NOTSET, logger_provider=logger_provider)
# Attach OTLP handler to root loggerlogging.getLogger().addHandler(handler)
# write logtracer.start_as_current_span("Write logs")
Query OpenTelemetry
Section titled “Query OpenTelemetry”-
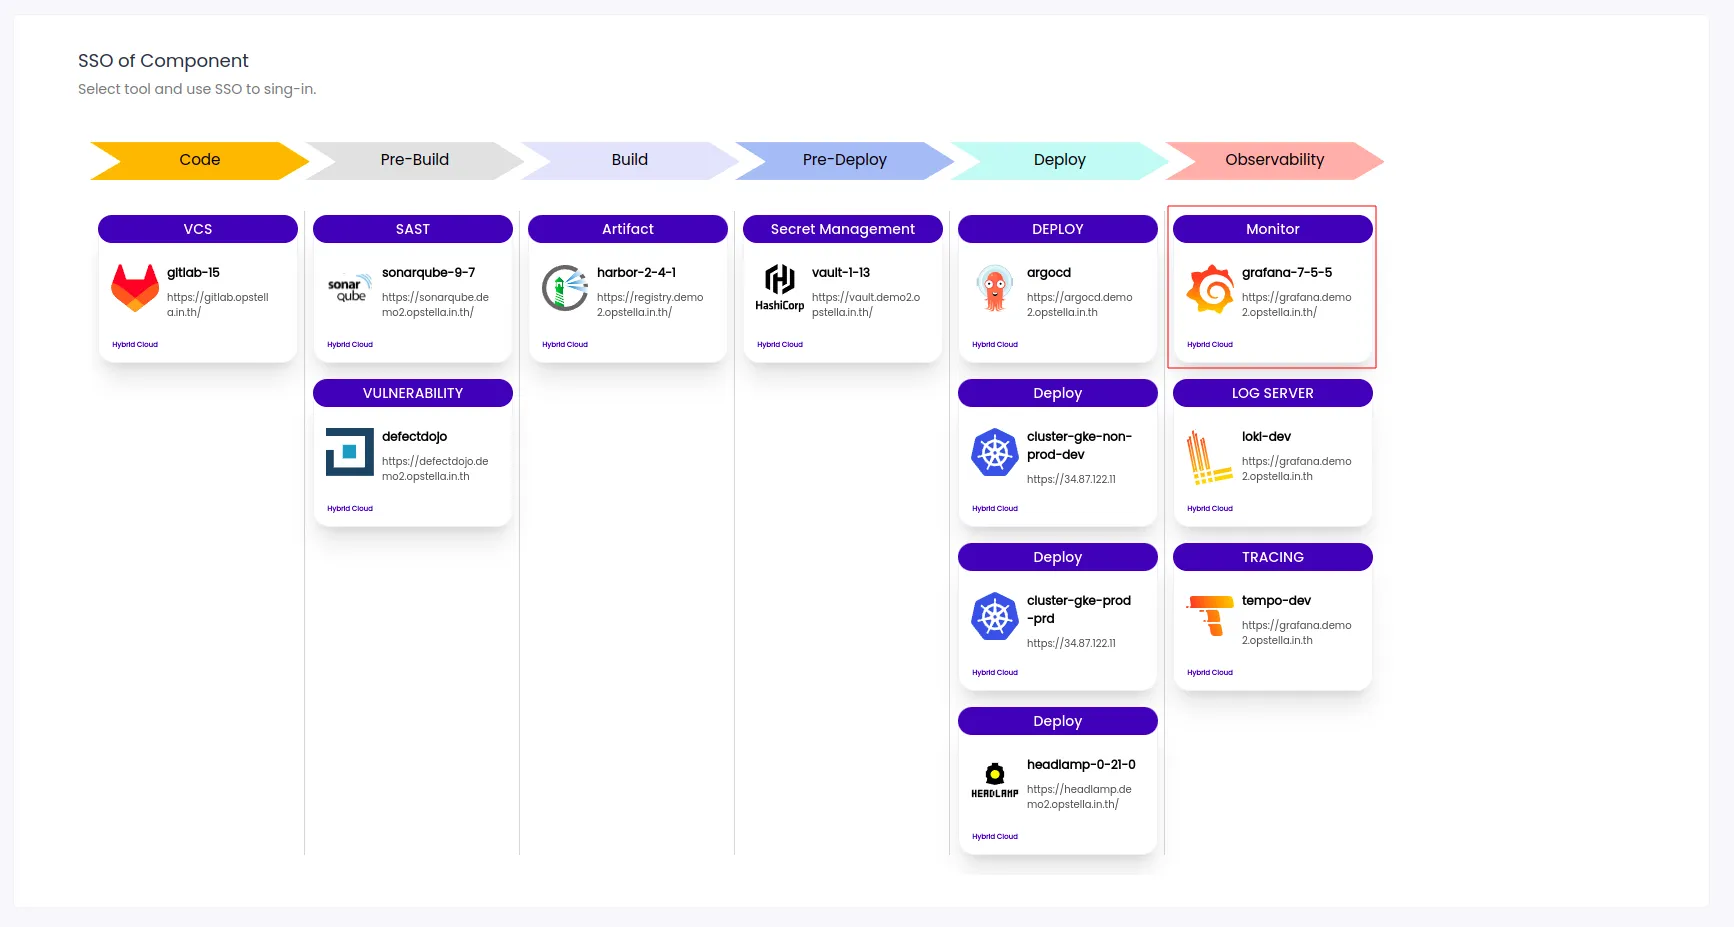
เปิดไปยังหน้า Component เลือก devops tool Grafana
-
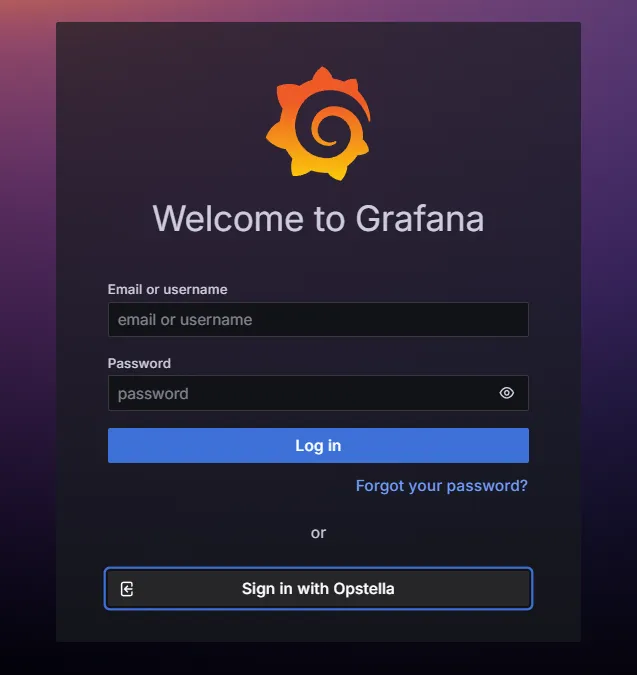
ระบบจะแสดงหน้าต่างขึ้นใหม่เพื่อเข้าสู่ Grafana ทำการเข้าสู่ระบบด้วยการคลิกที่ปุ่ม Sign in with Opstella ดังรูป
-
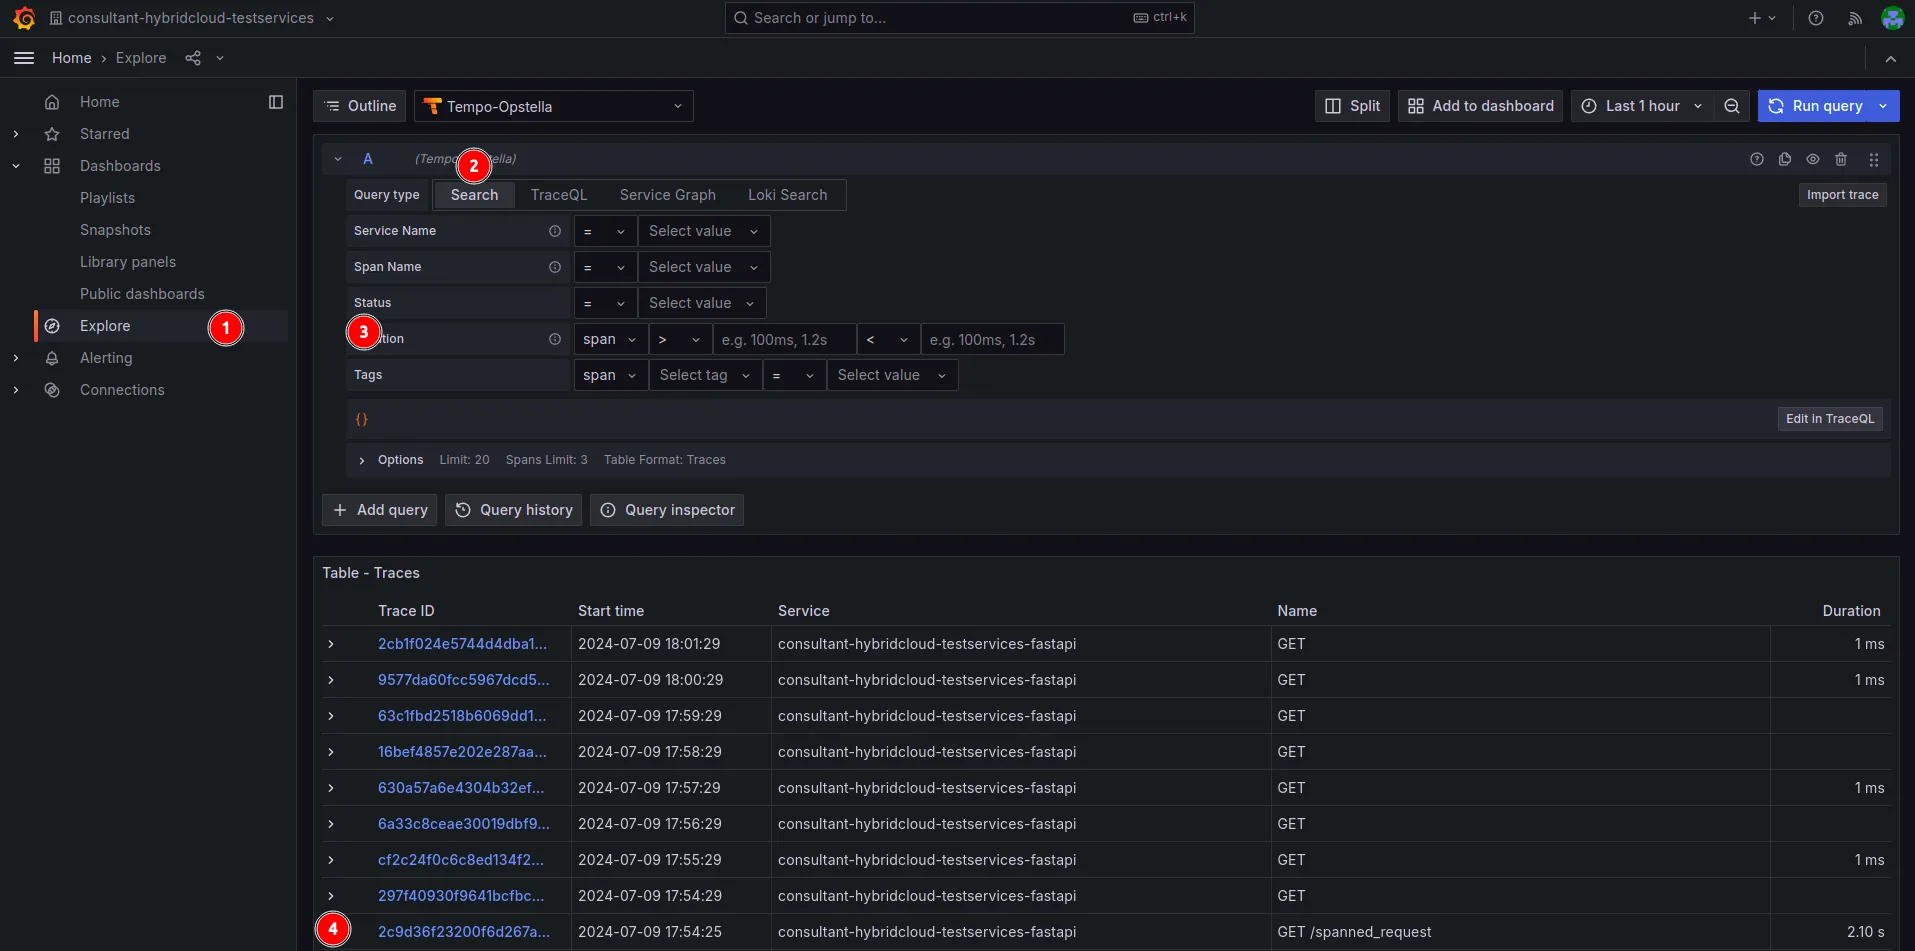
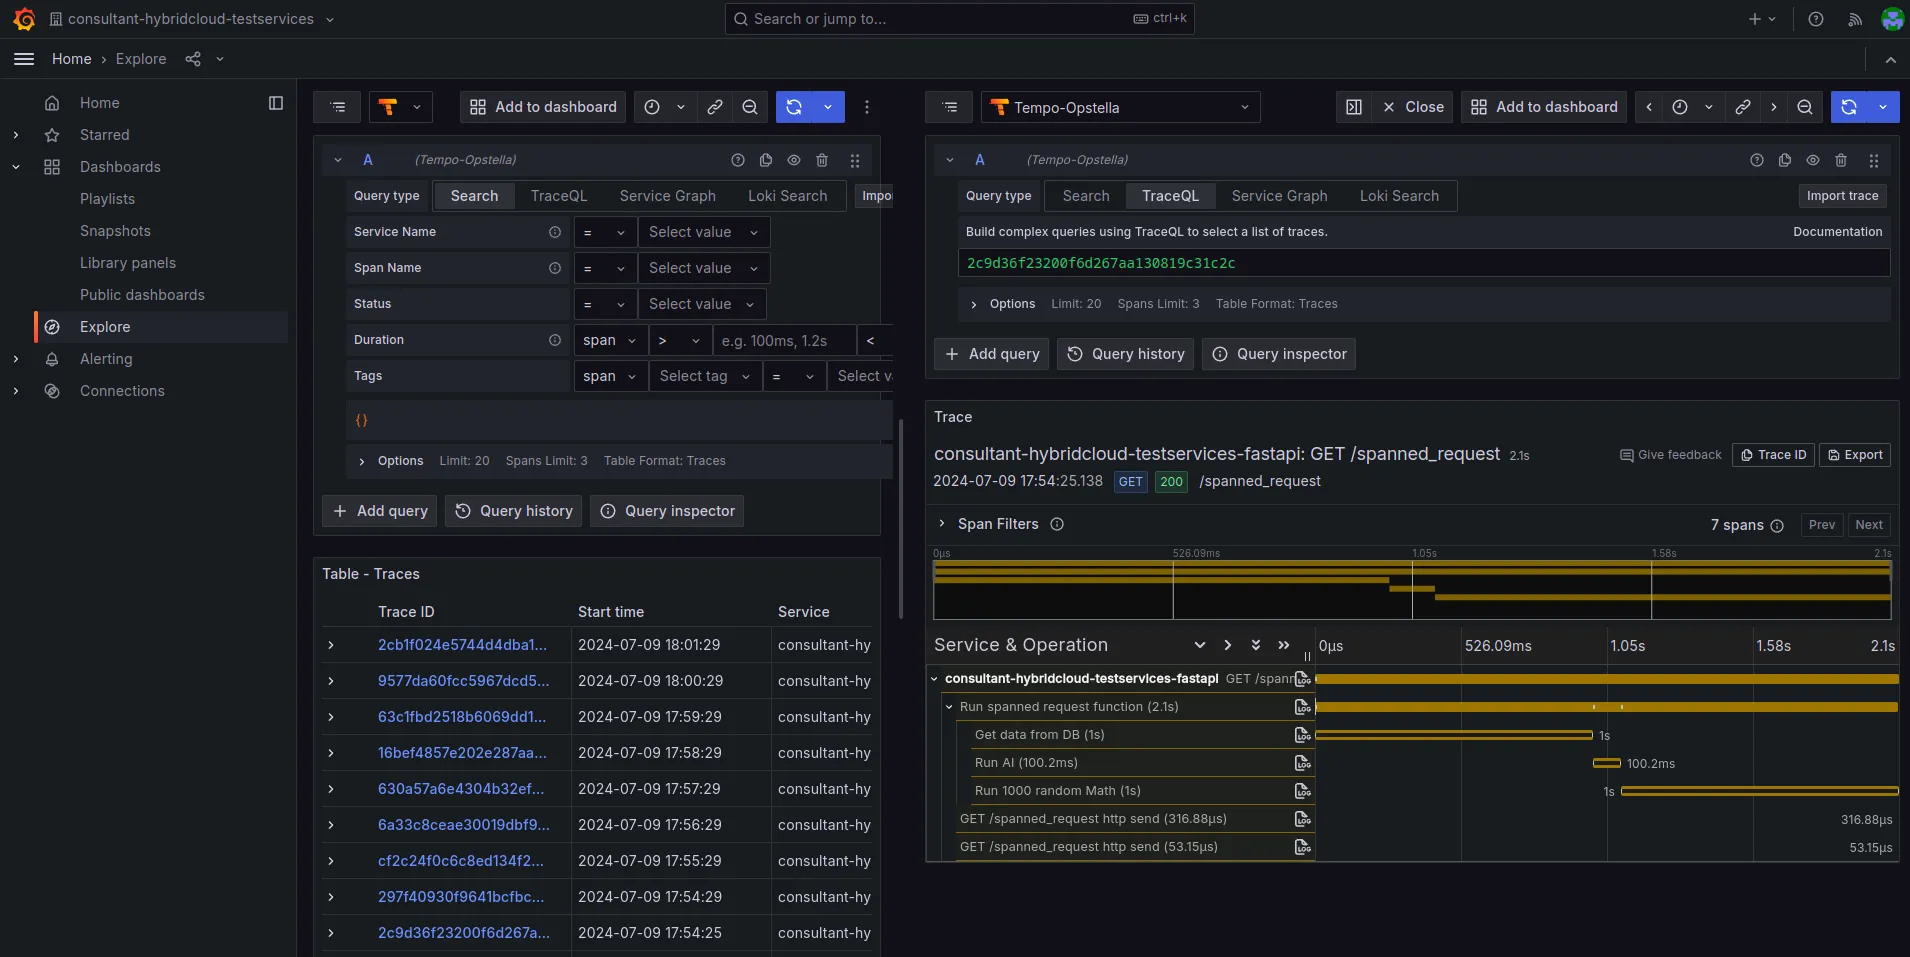
ที่เมนูด้านซ้ายกด Explore (1) จากกดที่เมนู Search (2) จะปรากฏรายการ filter ขึ้นมา ให้ลองดู Duration (3) ใช้สำหรับกรองว่าจะดูช่วงเวลาไหน จากนั้นให้ดูที่ ตาราง Trace ด้านล่างเลือก รายการ Tracing ที่ต้องการ
-
จะปรากฏรายการ Tracing สามารถดูว่าทำงานแต่ช่วงใช้เวลาเท่าไหร่ และกดเข้าไปดูรายละเอียดได้ ดังรูป
Finished?
Use the below navigation to proceed