This is the Experimental version (Latest). It is under active development and may change. For the most reliable documentation, use the version selector in the top-right to switch to Stable, or click here to go to the Stable version's homepage.
Gather Onboarded Application Logs
Last updated:
Prerequisites
Section titled “Prerequisites”- Logged in to Grafana with Opstella
- Application must expose Logs to
stdout
Instructions
Section titled “Instructions”-
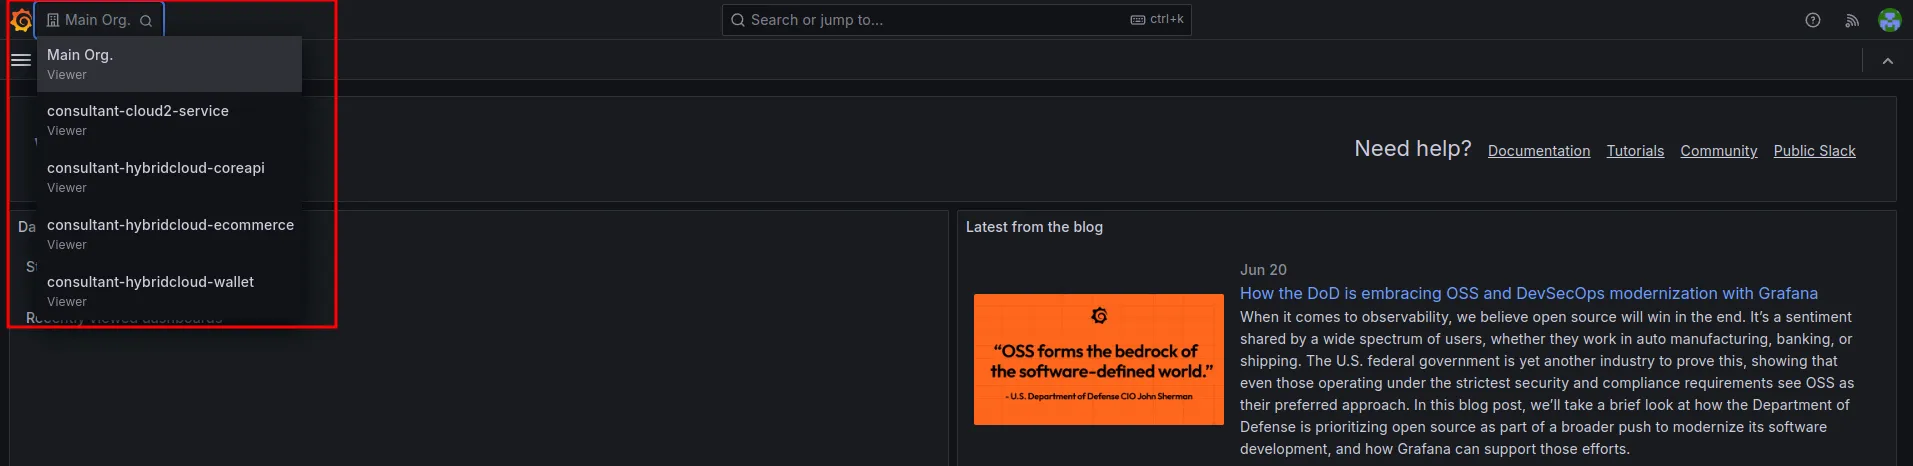
เลือก Organization ที่ต้องการที่เมนู Switch Organization โดยเลือก Organization ตามชื่อ Service ในระบบ Opstella
-
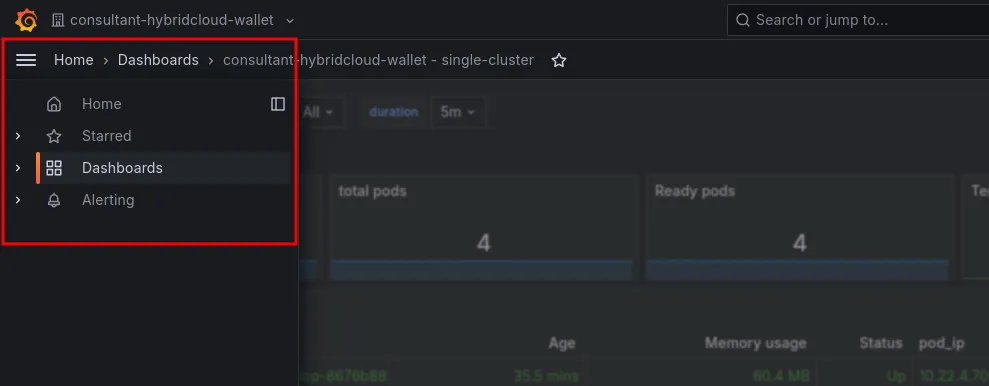
เลือกเมนู Dashboard ดังรูป
-
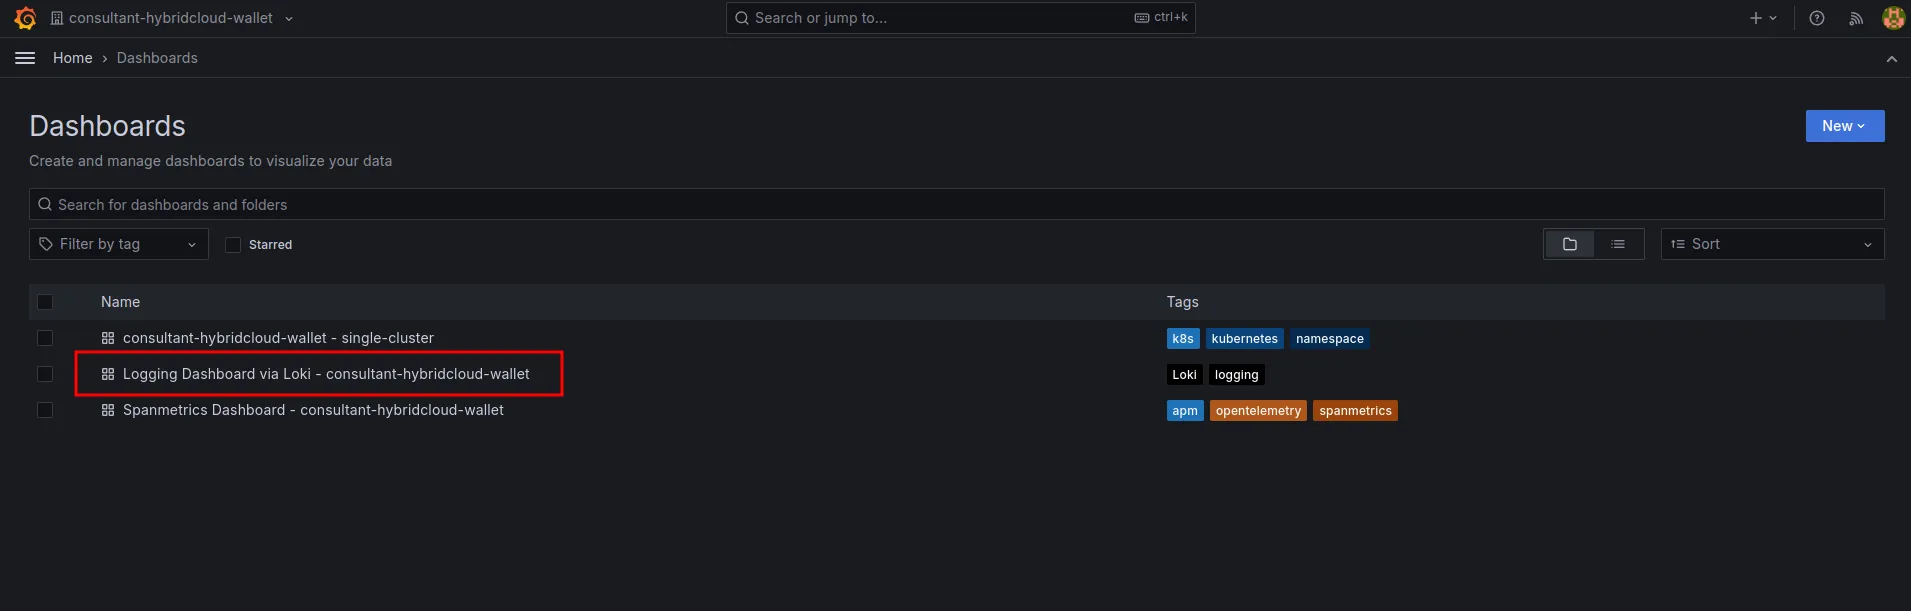
คลิกเลือก Dashborad ดังรูป เพื่อดู Log
-
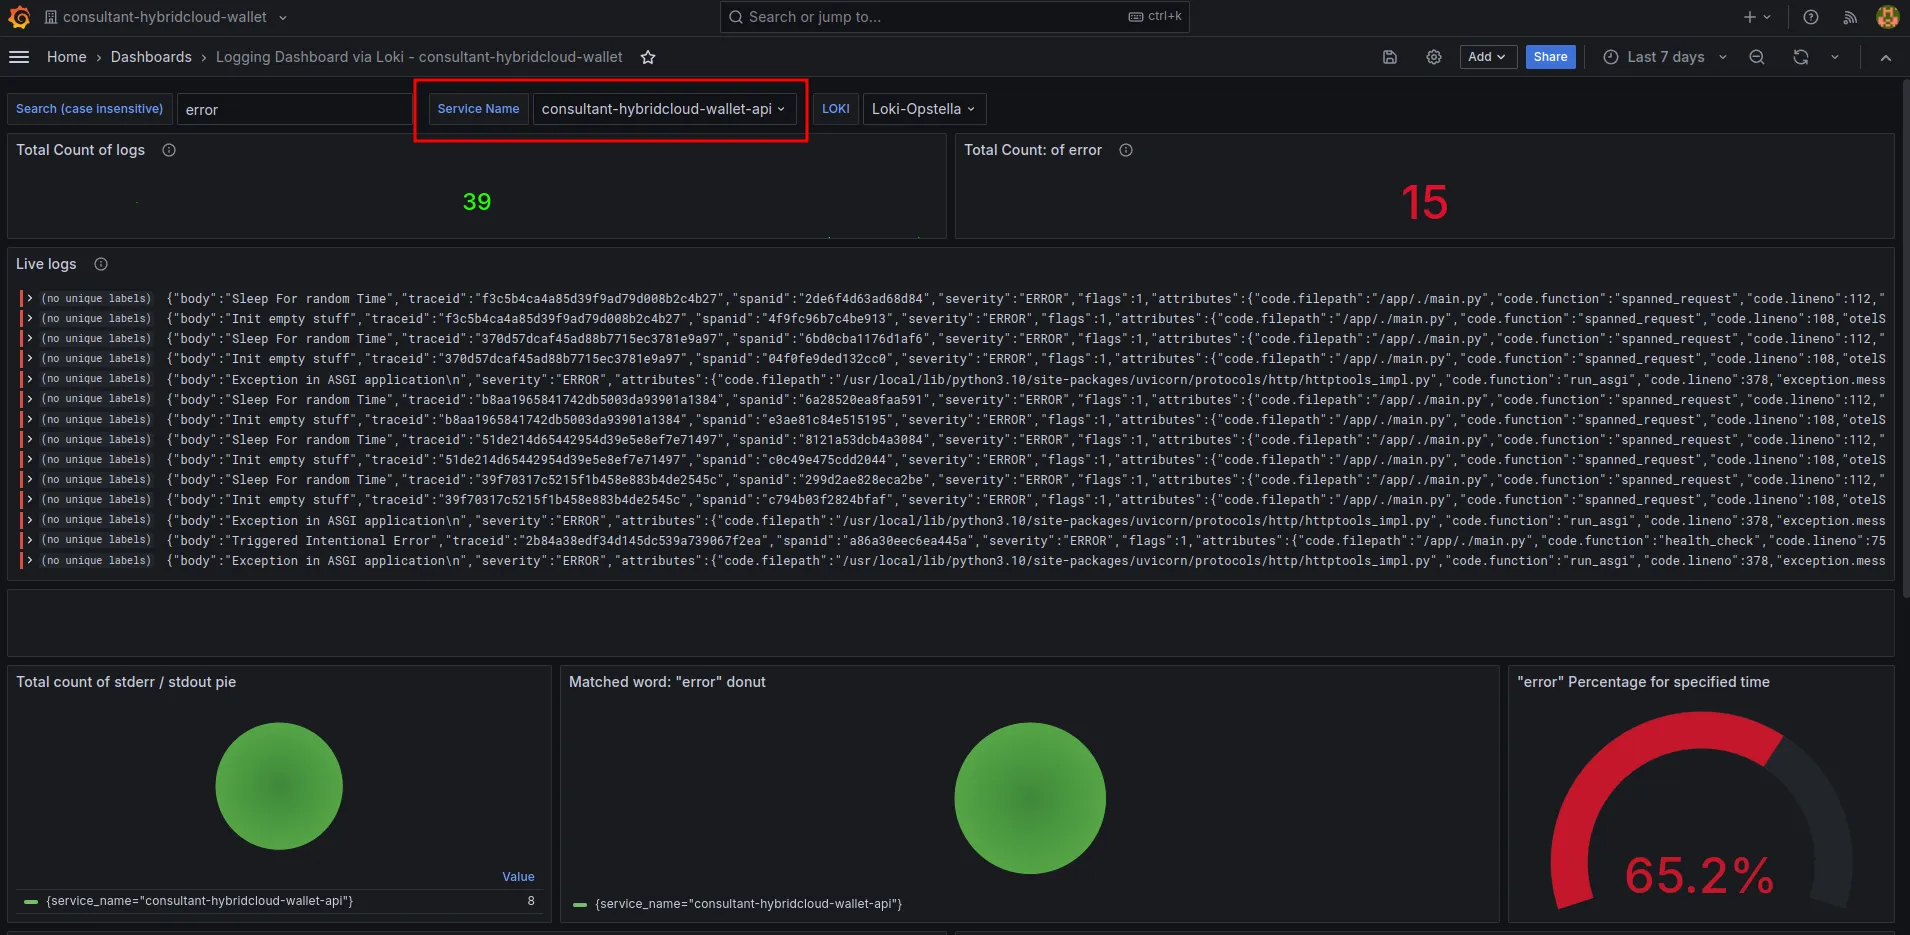
ระบบจะแสดง Dashboard Log โดยสามารถ Filter Service Name ได้ ดังรูป
Finished?
Use the below navigation to proceed