Getting Started for Developers
This content is not available in your language yet.
We’re excited to have you ’ Developers ’ here as you begin your journey with Opstella. 🎉🏃➡️
Taking advantages of Platform Engineering and DevSecOps Cycle, FAST.
This section provides overview and one-stop instructions of how to use Opstella, End-to-End in Day 1 Operations.
It is intended for developers who are new to Opstella and want to quickly get up to speed with its features and capabilities.
The key instructions include:
-
Accessing the Opstella Console
-
Onboarding Your First Application
-
Observe Application Status with Grafana LGTM Stack
-
Get into DevSecOps Tools
Alright, let’s get started! 💨
Accessing the Opstella Console
Section titled “Accessing the Opstella Console”-
Open your web browser and go to the following
URL:
https://opstella.CHANGEME.comYou will be presented with the Opstella login page as shown in the figure below.

-
Enter your Credentials (Authorized Username and Password).
-
Click the Login button to Log in.
-
Upon successful login, you will see the Opstella Welcome Page as shown in the figure below.

Explaination
Section titled “Explaination”| Symbol | Button Name | Description |
|---|---|---|
 | SSO | This feature provides a centralized access point for all integrated tools within the platform engineering environment |
 | App Inventory | This section displays your application inventory, organized by Platform List and platform relationships. It visually represents the connections between platforms, services, and components. Additionally, it serves as the central hub for managing platforms, services, components, and their associated permissions. |
 | User | This section allows you to manage all users within the system. Only the ‘Opstella’ user has access to this menu. |
 | Choose Platform | Browsing/Switching to the selected platform |
 | Server Status | This section displays the current connection status of integrated third-party tools. |
 | User Account | This section displays the currently logged-in user’s username, first name, and last name. |
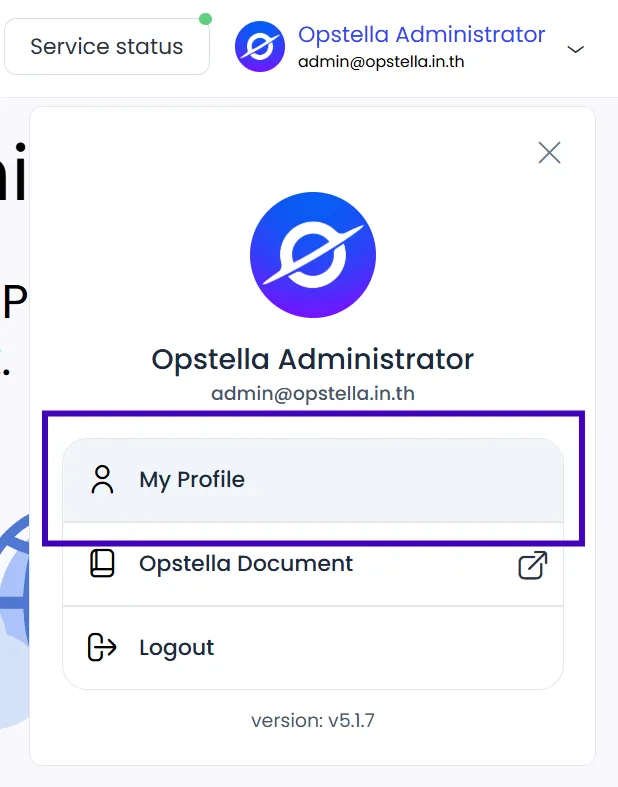 | User Profile | This section allows the currently logged-in user to modify their profile information.” |
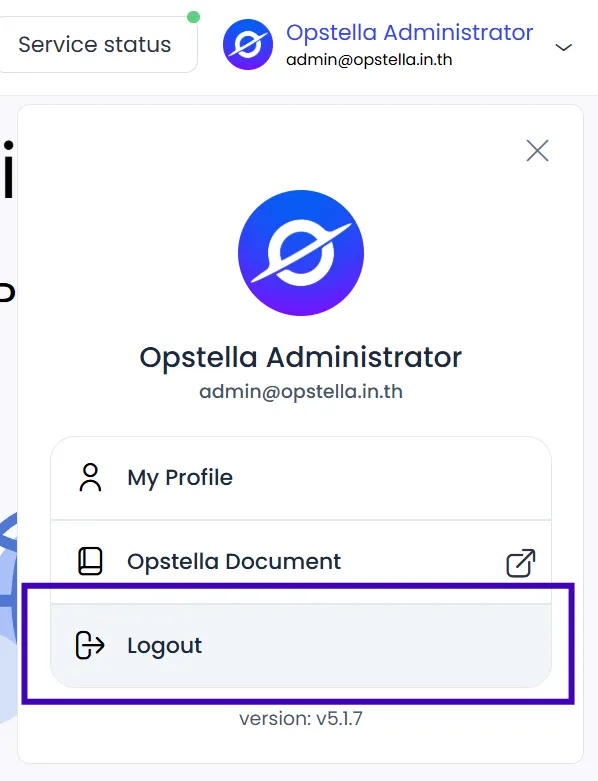 | Logout | This option allows the user to sign out from the system. |
Onboarding Your First Application
Section titled “Onboarding Your First Application”This section provides a step-by-step guide on how to onboard your first application with Opstella.
Create a Platform
Section titled “Create a Platform”-
Create a Platform
Section titled “Create a Platform”Access Platform Creation:
- Go to the “App Inventory” menu.

- Click the “Create Platform” button in the top-right corner.

-
Complete Platform Details.
Section titled “Complete Platform Details.”- Platform Name: Enter a unique name for the service.
- Platform Description: Provide a brief description of the service.
- Specify the Resource Quotas for the platform. (See the left side of the figure below.)
- Assign User Permissions by selecting the appropriate users. (See the right side of the figure below.)

-
Select DevSecOps Tools Set
Section titled “Select DevSecOps Tools Set”Choose the DevSecOps Tools Set for the Platform.
💡 Note: The sets shown may vary depending on your organization.

-
Review and Create Platform.
Section titled “Review and Create Platform.”Confirm and Proceed:
- Click the “Confirm” button after entering all information.
Finalize Platform Creation:
- Review the confirmation window displaying the entered details.
- Click the “Create Platform” button to complete the process.

Create a Service
Section titled “Create a Service”-
Create a Service, under the previously created Platform.
Section titled “Create a Service, under the previously created Platform.”Access Service Creation:
- Select the platform from the platform list.
- Click the options menu (three dots) and choose “Create Service”.

-
Complete Service Details.
Section titled “Complete Service Details.”Fill in the required service details:
- Service Name: Enter a unique name for the service.
- Service Description: Provide a brief description of the service.

-
Select the Desired Edition.
Section titled “Select the Desired Edition.”- If you have ONLY Container Operation Edition, DevSecOps Edition won’t be available.
- For this example, select DevSecOps Edition.

-
Review and Create Service.
Section titled “Review and Create Service.”Confirm and Proceed:
- Click the “Confirm” button after entering all information.
Finalize Service Creation:
- Review the confirmation window displaying the entered details.
- Click the “Create Service” button to complete the process.

Create a Component
Section titled “Create a Component”-
Create a Component, under the previously created Service.
Section titled “Create a Component, under the previously created Service.”Access Component Creation:
- In the service list, select the desired service.
- Click the “Create Component” button or click options menu (three dots) and choose “Create Component”.

-
Select a Software Template.
Section titled “Select a Software Template.”Choose ONLY one:
- Choose Blank Template, to start create your application from scratch.
- Choose Any of the showing templates (Opstella Templates/Global Templates/Platform Templates), to start create your application from a well-made templates.
💡 Note: The Source Code Template shown may vary depending on your organization.

-
Complete Component Details.
Section titled “Complete Component Details.”- Enter the required details on the left side of the page.
- Manage user permissions for the component on the right side.

-
Confirm and Create Component.
Section titled “Confirm and Create Component.”- Click the “Confirm” button after completing all information.
- Review the confirmation window and click “Create Component” to complete the process.

Access Component Details and GitLab
Section titled “Access Component Details and GitLab”-
Access Component Details and GitLab
View Component Details:
-
After creation, you will be redirected to the Service List page.
-
Select the component and choose “Details” from the options menu (three dots).
Manage Source Code:
-
The component information and associated DevOps tools will be displayed.
-
Go to the GitLab menu to manage the source code.
Single Sign-On (SSO) Login:
-
Click the GitLab tool logo.
-
You will be redirected to GitLab, where you can use the Opstella button for SSO login.
-
-
Merge Source Code in GitLab
Access Merge Requests:
-
After logging in, you will see your projects with two branches: “develop” and “template”.
-
The “template” branch contains code in your selected programming language.
Initiate Merge Request:
- Click the “Code” menu and click “Merge requests” in the left-hand menu.
Create Merge Request:
-
Select “Create merge request” from the “template” branch to the “develop” branch.
-
Click “Compare branches and continue”.
Verify the Merge:
- After a successful merge, the code in the “develop” branch will reflect the merged code.
-
-
Execute the Pipeline
Trigger the Pipeline:
-
Merging source code into the “develop” branch automatically starts the pipeline.
-
Monitor the pipeline’s progress by clicking “Build” and selecting “Pipeline” in the left-hand menu.
View Pipeline Details:
-
You will be redirected to the pipeline page.
-
This page shows detailed information about each job in the pipeline.
Confirm Successful Execution:
- After all pipeline jobs complete successfully, a visual confirmation will be displayed.
-
Access the Deployed Application
Section titled “Access the Deployed Application”-
Access the Deployed Application
Return to Component Details:
- After the pipelines have run successfully, return to the component details page.
Select the Deployed Ingress:
- Choose the deployed “Ingress”.
Access the Application:
- A new window will open, displaying your deployed application.
Observe Application Status
Section titled “Observe Application Status”After your application is onboarded and deployed, you can monitor its tracing and system status using the Grafana LGTM stack.
There are several ways to access the monitoring dashboard, but this document will demonstrate access through the Component Details page.
-
Navigate to Platform List
Section titled “Navigate to Platform List”Go to the Platform List and select the desired platform.
-
Access Service List
Section titled “Access Service List”You will be taken to the Service List page.
-
View Component Details
Section titled “View Component Details”Select the component and choose “Details” from the options menu (three dots).
-
Access Observability Tools
Section titled “Access Observability Tools”On the Component Details page, scroll down to the “SSO of Component” section.
-
Select Observability Tool
Section titled “Select Observability Tool”Choose the desired observability tool.
-
Login to Grafana
Section titled “Login to Grafana”Grafana will open in a new window.
Select “Sign in with Opstella” to log in.
-
View Dashboards
Section titled “View Dashboards”The Grafana dashboards will be displayed.
Select the dashboard you want to view.
Get into DevSecOps Tools
Section titled “Get into DevSecOps Tools”Opstella will centralize authentication and authorization for all your DevSecOps tools in a single portal.
-
Navigate to the SSO Menu
Section titled “Navigate to the SSO Menu”Go to the SSO menu on the right-hand side.
-
View Available Tools
Section titled “View Available Tools”The SSO page will display the available tools. (Note: The tools shown may vary depending on your organization.)
Choose the desired platform from the platform menu.
-
Access a Tool
Section titled “Access a Tool”Select the desired tool. In this case, select “ArgoCD”.
-
Select a Service
Section titled “Select a Service”Select a Service that is under the Platform that you have chosen.
-
Select an Environment
Section titled “Select an Environment”Choose the environment (e.g., dev, uat, or prod).
-
Login to Tool
Section titled “Login to Tool”The tool’s login page will open.
Select “LOG IN VIA OPSTELLA”.
-
View Applications
Section titled “View Applications”You will be logged in and see the applications that you have permission to access.