This is the Experimental version (Latest). It is under active development and may change. For the most reliable documentation, use the version selector in the top-right to switch to Stable, or click here to go to the Stable version's homepage.
Grafana Dashboard Installation
อัพเดทล่าสุด:
เนื้อหานี้ยังไม่มีในภาษาของคุณ
Grafana Dashboard is a Centralised Observability Dashboard
Prerequisites
Section titled “Prerequisites”Kubernetes Cluster
Section titled “Kubernetes Cluster”Grafana Dashboard will be installed on 🟢 Management Kubernetes Cluster
- 📥Ingress Service provided as Kubernetes Ingress Class (
IngressClass) - 🛡️TLS Certificate for Grafana Dashboard provided as Kubernetes Secret
- Grafana Dashboard will be exposed as HTTPS with Kubernetes Ingress.
Application Dependencies
Section titled “Application Dependencies”Grafana Dashboard depends on multiple dependencies to be up and running but only the following will be provisioned and/or managed by you.
- 📦PostgreSQL SQL Database ; Deploy external/dedicated instance of Database.
- In case will be installed on Kubernetes Cluster.
- Will require 💿Persistence Storage as Kubernetes Storage Class (
StorageClass)
- Will require 💿Persistence Storage as Kubernetes Storage Class (
- In case will be installed on Kubernetes Cluster.
To Setup Single Sign-On with Opstella (MUST be performed at the time of installation), you need
- 📦Opstella Keycloak
- Your dedicated Keycloak Realm.
foobar-opstella; Please change accordingly
- Your dedicated Keycloak Realm.
- 🔑OpenID Connect Credentials: Client ID, Client Secret.
- Gather Client ID, Client Secret - from Opstella Keycloak Appendix - Gathering Client ID, Client Secret
Provisioning Summary
Section titled “Provisioning Summary”Once finished everything, these are systems that up and running.
| No. | Tool | Description | Kubernetes Namespace | Kubernetes Cluster |
|---|---|---|---|---|
| 1. | PostgreSQL for Grafana Dashboard | Database System for Grafana Dashboard | observability-system | 🟢 Management |
| 2. | Grafana Dashboard | Centralised Observability Dashboard | observability-system | 🟢 Management |
Complete Prerequisites
Section titled “Complete Prerequisites”Kubernetes Cluster
Section titled “Kubernetes Cluster”Prepare Shell Variables
Section titled “Prepare Shell Variables”Ensure you have defined and loaded your Global Shell Variables as described in Shell Variables.
-
Connect to
🟢 ManagementKubernetes Cluster ; i.e w/ Kubeconfig FileEnsure you have defined and loaded your Global Shell Variables as described in Shell Variables.
Terminal window source $HOME/opstella-installation/shell-values/kubernetes/management_cluster.vars.sh -
Set
🟢 ManagementKubernetes Cluster InformationEnsure
GRAFANA_DASHBOARD_DOMAIN,K8S_INTERNAL_DOMAIN,K8S_INGRESSCLASS_NAME,K8S_STORAGECLASS_NAME,K8S_INGRESS_TLS_CERTIFICATE_SECRET_NAMEare defined as per the Shell Variables guide. -
Create Kubernetes Secret for 🛡️ TLS Certificate for Grafana Dashboard in Namespace
observability-system.Kubernetes Ingress for Grafana Dashboard will associate TLS Certificate with Kubernetes Secret named
wildcard-${BASE_DOMAIN}-tls.(Ensure
K8S_INGRESS_TLS_CERTIFICATE_SECRET_NAMEis defined in your variables)Create one using from
.crtand.keyfile.Terminal window kubectl create secret tls $K8S_INGRESS_TLS_CERTIFICATE_SECRET_NAME \--cert=/path/to/cert/file --key=/path/to/key/file \--namespace observability-system💡 Should return
secret/wildcard-${BASE_DOMAIN}-tls createdmessage.
Application Dependencies
Section titled “Application Dependencies”PostgreSQL SQL Database
Section titled “PostgreSQL SQL Database”-
Set PostgreSQL Information
- Database Name:
grafana_dashboard - Database User:
grafana_dashboard_user - Database Password:
CHANGEME- NOTE: Only Allowed Special Characters are
!-_=+?@
- NOTE: Only Allowed Special Characters are
(Ensure DB name and user variables are loaded from
observability.vars.sh) - Database Name:
-
Provision PostgreSQL for Grafana Dashboard
The following manifest defines the entire PostgreSQL system, including credentials and the CNPG cluster.
Terminal window cat <<EOF > $BASE_WORKING_DIR/kubernetes-manifests/grafana-dashboard-postgres.yaml---# Postgres Superuser (root) CredentialsapiVersion: v1kind: Secrettype: kubernetes.io/basic-authmetadata:name: grafana-dashboard-postgres-superusernamespace: observability-systemstringData:username: postgrespassword: "${GRAFANA_DASHBOARD_POSTGRES_SUPERUSER_PASSWORD}"---# Grafana Dashboard Application User CredentialsapiVersion: v1kind: Secrettype: kubernetes.io/basic-authmetadata:name: grafana-dashboard-postgres-usernamespace: observability-systemstringData:username: "${GRAFANA_DASHBOARD_DB_USER}"password: "${GRAFANA_DASHBOARD_POSTGRES_USER_PASSWORD}"---# S3 Credentials for Postgres Backups (to SeaweedFS HA)apiVersion: v1kind: Secrettype: Opaquemetadata:name: grafana-dashboard-postgres-s3-secretnamespace: observability-systemstringData:S3_ACCESS_KEY: "postgres-backup"S3_SECRET_KEY: "${SEAWEEDFS_HA_S3_POSTGRES_BACKUP_PASSWORD}"---apiVersion: barmancloud.cnpg.io/v1kind: ObjectStoremetadata:name: grafana-dashboard-postgres-backupnamespace: observability-systemspec:# This resource defines the backup destination for the Barman Cloud Pluginconfiguration:destinationPath: s3://postgres-backups/endpointURL: http://seaweedfs-s3.apps-supporting-services.svc:9000s3Credentials:accessKeyId:name: grafana-dashboard-postgres-s3-secretkey: S3_ACCESS_KEYsecretAccessKey:name: grafana-dashboard-postgres-s3-secretkey: S3_SECRET_KEYwal:compression: gzipdata:compression: gzip# Retention policy for backups and WALs handled by the pluginretentionPolicy: "30d"---apiVersion: postgresql.cnpg.io/v1kind: Clustermetadata:name: grafana-dashboard-postgresnamespace: observability-systemlabels:app.kubernetes.io/name: grafana-dashboard-postgresapp.kubernetes.io/part-of: grafana-dashboardspec:instances: 1# Image configuration (Postgres 15)imageName: ghcr.io/cloudnative-pg/postgresql:15# Enable the Barman Cloud Plugin for backupsplugins:- name: barman-cloud.cloudnative-pg.ioisWALArchiver: trueparameters:serverName: "grafana-dashboard-postgres"barmanObjectName: "grafana-dashboard-postgres-backup"# Storage Configurationstorage:size: 5GistorageClass: "${K8S_STORAGECLASS_NAME}"walStorage:size: 2GistorageClass: "${K8S_STORAGECLASS_NAME}"# Bootstrap Configurationbootstrap:initdb:database: "${GRAFANA_DASHBOARD_DB_NAME}"owner: "${GRAFANA_DASHBOARD_DB_USER}"# Secret containing password for the Application Usersecret:name: grafana-dashboard-postgres-user# Superuser credentials (root/postgres)superuserSecret:name: grafana-dashboard-postgres-superuser# Backup Configuration (Barman Cloud Plugin will automatically detect matching ObjectStore)backup:{}# Monitoring (disabled for now)monitoring:enablePodMonitor: false# Resourcesresources:requests:memory: "256Mi"cpu: "200m"limits:memory: "1Gi"cpu: "1000m"EOFApply the configuration:
Terminal window kubectl apply --namespace observability-system \-f grafana-dashboard-postgres.yaml💡 Should return
secret/grafana-dashboard-postgres-superuser,secret/grafana-dashboard-postgres-user, andcluster.postgresql.cnpg.io/grafana-dashboard-postgrescreated messages. -
Check for PostgreSQL for Grafana Dashboard Readiness - MUST be Ready and Running.
Get Pod Status - PostgreSQL for Grafana Dashboard
Terminal window kubectl get pods -n observability-system💡 PostgreSQL for Grafana Dashboard Pods MUST be
RunningNAME READY STATUS RESTARTS AGE... (deducted)postgresql-grafana-dashboard-1 2/2 Running 0 XdXhpostgresql-grafana-dashboard-2 2/2 Running 0 XdXhpostgresql-grafana-dashboard-3 2/2 Running 0 XdXh
Pre-Installation
Section titled “Pre-Installation”Prepare Grafana Dashboard Configurations
Section titled “Prepare Grafana Dashboard Configurations”-
Set Grafana Dashboard Entrypoint Domain
(Ensure Grafana Dashboard Domain is loaded from your variables)
-
Create/Store Grafana Dashboard Credentials for Initial Admin Account
- Username:
admin(Cannot be changed)
Create Kubernetes Secret named
grafana-dashboard-admin-credentialsTerminal window kubectl apply --namespace observability-system -f - <<EOFapiVersion: v1kind: Secretmetadata:name: grafana-dashboard-admin-credentialsstringData:admin-user: adminadmin-password: ${GRAFANA_DASHBOARD_PASSWORD}EOF- PostgreSQL Connection and Credentials
- Use previously mentioned in Application Dependencies/PostgreSQL for Grafana Dashboard
(Ensure Database Host configuration is loaded from variables)
- Username:
Prepare Grafana Dashboard Single Sign-On Configurations
Section titled “Prepare Grafana Dashboard Single Sign-On Configurations”-
Specify OIDC Authentication Information
Using Opstella Keycloak Information
-
Opstella Keycloak Domain:
idp.${BASE_DOMAIN}(Ensure these Keycloak configuration variables are loaded from your
observability.vars.sh) -
Client secret: (Stored in observability.vars.sh)
-
-
Create Kubernetes Secret named
grafana-dashboard-idp-credentialsTerminal window kubectl apply --namespace observability-system -f - <<EOFapiVersion: v1kind: Secretmetadata:name: grafana-dashboard-idp-credentialsstringData:client_id: ${GRAFANA_DASHBOARD_OIDC_CLIENT_ID}client_secret: ${GRAFANA_DASHBOARD_OIDC_CLIENT_SECRET}EOF
Create Grafana Dashboard Configurations
Section titled “Create Grafana Dashboard Configurations”-
Create Helm Values Configurations
Terminal window cat <<EOF > $BASE_WORKING_DIR/helm-values/grafana-dashboard-full-values.yamlingress:enabled: trueingressClassName: ${K8S_INGRESSCLASS_NAME}path: /pathType: Prefixhosts:- ${GRAFANA_DASHBOARD_DOMAIN}tls:- secretName: ${K8S_INGRESS_TLS_CERTIFICATE_SECRET_NAME}hosts:- ${GRAFANA_DASHBOARD_DOMAIN}admin:existingSecret: grafana-dashboard-admin-credentialspersistence:enabled: falseextraSecretMounts:## OPSTELLA_CUSTOMIZE: Single Sign-On Integration- name: auth-generic-oauth-secret-mountsecretName: grafana-dashboard-oidc-credentialsdefaultMode: 0440mountPath: /etc/secrets/grafana-dashboard-idp-credentialsreadOnly: true- name: db-auth-secret-mountsecretName: grafana-dashboard-db-credentialsdefaultMode: 0440mountPath: /etc/secrets/grafana-dashboard-db-credentialsreadOnly: true## Grafana's primary configuration## NOTE: values in map will be converted to ini format## ref: http://docs.grafana.org/installation/configuration/##grafana.ini:server:## OPSTELLA_CUSTOMIZE: Enable gzip for Optimized Front-end Performanceenable_gzip: true## OPSTELLA_CUSTOMIZE: Single Sign-On Integration/Required for OAuth Protocol ##root_url: https://${GRAFANA_DASHBOARD_DOMAIN}domain: ${GRAFANA_DASHBOARD_DOMAIN}## OPSTELLA_CUSTOMIZE: Utilize External Databasedatabase:type: postgreshost: ${GRAFANA_DASHBOARD_DB_HOST}name: ${GRAFANA_DASHBOARD_DB_NAME}user: \$__file{/etc/secrets/grafana-dashboard-db-credentials/username}password: \$__file{/etc/secrets/grafana-dashboard-db-credentials/password}ssl_mode: disableauth:## OPSTELLA_CUSTOMIZE: Enable Matching Users with their email## See: https://github.com/grafana/grafana/issues/74154oauth_allow_insecure_email_lookup: trueauth.generic_oauth:## OPSTELLA_CUSTOMIZE: Single Sign-On Integration## See: https://github.com/grafana/grafana/issues/74154enabled: truename: Opstellaclient_id: \$__file{/etc/secrets/grafana-dashboard-idp-credentials/client_id}client_secret: \$__file{/etc/secrets/grafana-dashboard-idp-credentials/client_secret}auth_url: ${OIDC_ISSUER_ENDPOINT}/protocol/openid-connect/authtoken_url: ${OIDC_ISSUER_ENDPOINT}/protocol/openid-connect/tokenapi_url: ${OIDC_ISSUER_ENDPOINT}/protocol/openid-connect/userinfoemail_attribute_name: email:primaryscopes: openid profile email## OPSTELLA_CUSTOMIZE: Opstella Platform will manage Roles of a User within Organzationskip_org_role_sync: trueEOF
Helm Chart Preparation
Section titled “Helm Chart Preparation”-
Add Grafana Helm Repository
Terminal window helm repo add grafana https://grafana.github.io/helm-chartshelm repo update
Installation
Section titled “Installation”-
Check for PostgreSQL for Grafana Dashboard Readiness - MUST be Running and Ready.
Get Pod Status - PostgreSQL for Grafana Dashboard
Terminal window kubectl get pods -n devsecops-system💡 PostgreSQL for Grafana Dashboard Pods MUST be
RunningNAME READY STATUS RESTARTS AGE... (deducted)postgresql-grafana-dashboard-1 2/2 Running 0 XdXhpostgresql-grafana-dashboard-2 2/2 Running 0 XdXhpostgresql-grafana-dashboard-3 2/2 Running 0 XdXh -
Install Grafana Dashboard
-
Install a Helm Release with specific Helm Chart Version
--version 8.10.3(App Version: 11.5.2)Terminal window helm upgrade --install grafana grafana/grafana --version 8.10.3 \--namespace observability-system \-f $HOME/opstella-installation/helm-values/grafana-dashboard-full-values.yaml
-
Post-Installation
Section titled “Post-Installation”Grafana Dashboard Testing
Section titled “Grafana Dashboard Testing”-
Get Pod Status - Grafana Dashboard
Terminal window kubectl get pods -n observability-system💡 Grafana Dashboard Pod should be
RunningNAME READY STATUS RESTARTS AGE... (deducted)grafana-dashboard-XXXXXXX-YYYY 1/1 Running 0 XdXh -
Visit
https://grafana.${BASE_DOMAIN}- It should be accessible.
- TLS Certificate should be valid and coresponding to your TLS Certificate Installed
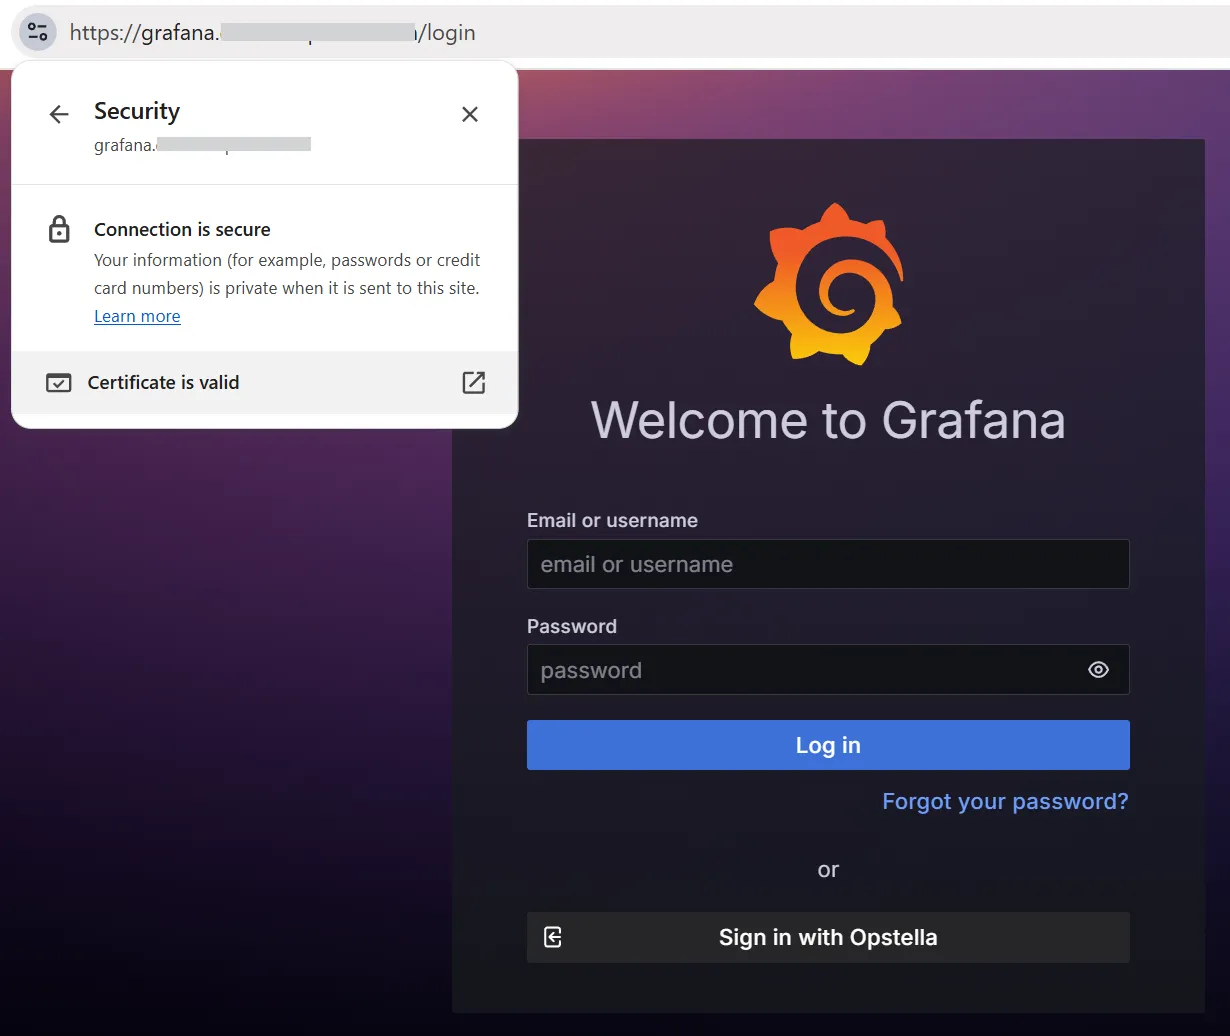
-
Login with Users
- Try to login with Initial Admin Account (admin,
$GRAFANA_DASHBOARD_PASSWORD), if success then it works.
- Try to login with Initial Admin Account (admin,
Finished?
Use the below navigation to proceed